

515. Visuals that explain everything 🍭
10 cool graphics, charts, and visuals for a new perspective on your work & life

Hellooo 👋 So happy to have you here. I’m Kevan. I have spent 15+ years as a head of marketing for some cool tech startups. Now I’ve co-founded a brand storytelling business called Bonfire. We do coaching, advisory, and content. If you identify with creativity and marketing, we’d love for you to join us.
10 Visuals That Explain Everything
If you’d like to hear about my biggest career failures and deepest insecurities, you’re in luck! Recently I was a guest on Andrew Capland’s Delivering Value podcast, and my episode just came out. Give it a listen and let me know what you think!
The title of the podcast is “The Most Imposter Syndrome I’ve Ever Felt …”, which is a direct quote from the episode or, if you stop reading after the first four words (as I did), sounds like an award I’ve won. It’s true that I definitely have my moments of superlative imposter syndrome. And in these moments, I’m grateful for some awesome articles and calming visuals to pull me out of my funk.

Reflecting back on this visual made me recall a few other visuals that I’ve found helpful or life-changing or thought-provoking or cool.
I thought I’d round them up for you in this week’s newsletter.
1. T-shaped marketers
The full explanation comes from this article I wrote a looooong time ago.

2. Time + Fortune = All stories, ever
From this wonderful article on the origins of all storytelling.


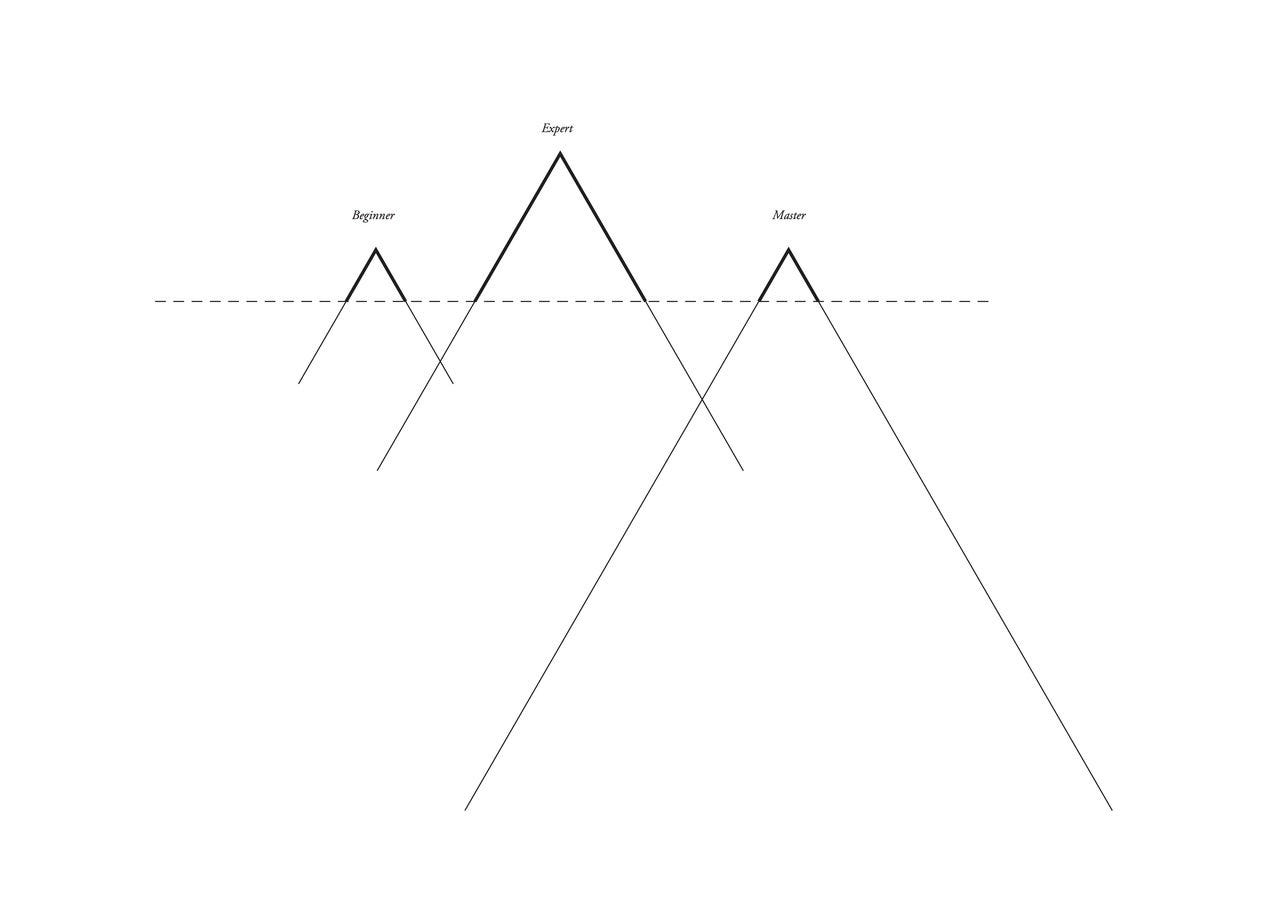
3. Beginner > Expert > Master
Art print from Joey Roth. (You can get it framed here.)
4. Belief-behavior iceberg
This is a graphic someone shared with me in a workshop, and I liked it so much that I had to recreate it digitally. It shows that the behaviors we see in ourselves and from others are often driven by our hidden beliefs, which are a much bigger proportion of the total picture.

5. Your life in weeks
In Tim Urban’s Wait But Why blog, he created graphic representations of all the days, weeks, months, and years in a 90-year-old person’s life. Looking at life in this way, you can begin to count how many pizzas you have left or, more emotionally, how much time you’ve spent and how much time you have remaining with your loved ones.
It turns out that when I graduated from high school, I had already used up 93% of my in-person parent time. I’m now enjoying the last 5% of that time. We’re in the tail end. 👇

6. Doing your best might look different each day
From Liz Fosslein

7. On letting go
From Quoted Visually

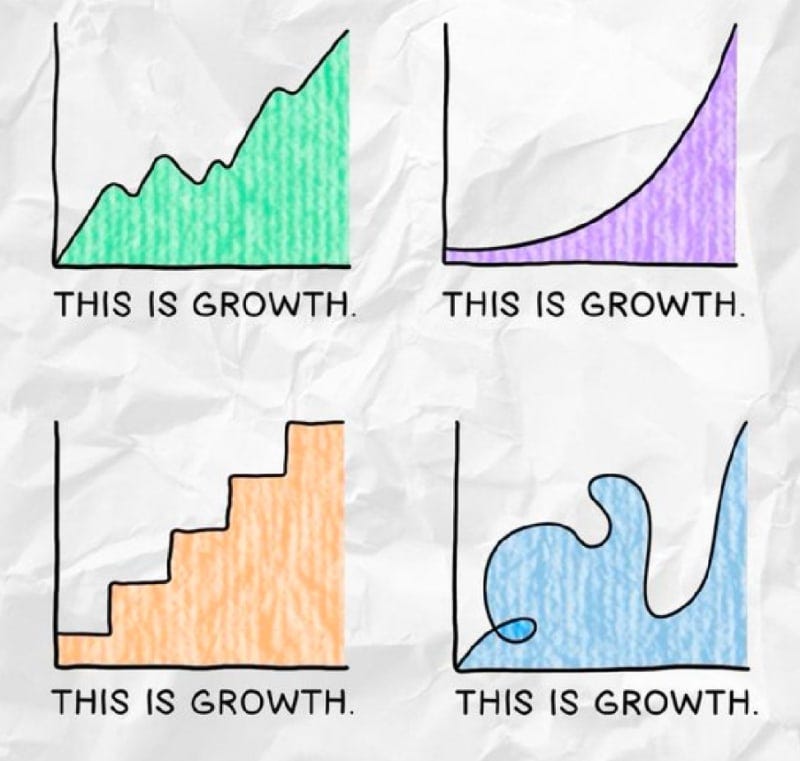
8. Growth looks different for everyone
From the DEV community
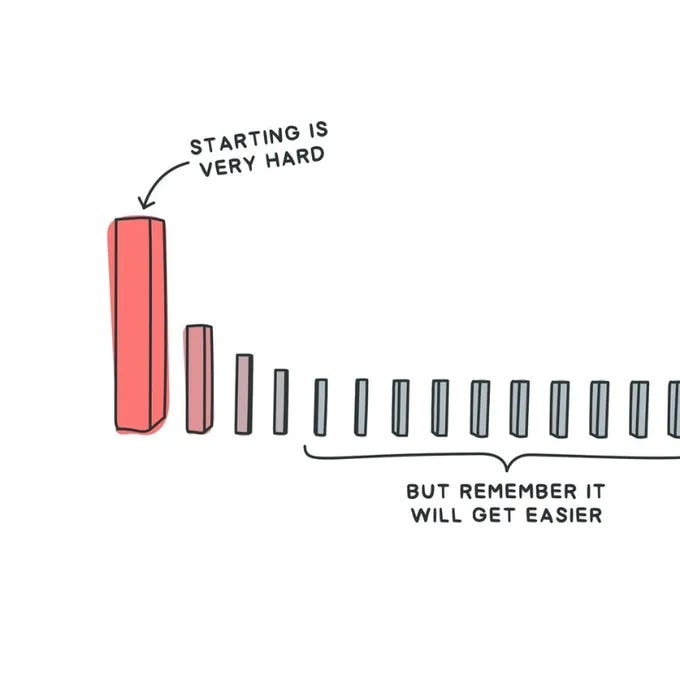
9. Starting is hard, but it gets easier
From SuccessPod
10. The difference between features and benefits
From the User Onboard blog (and reproduced so many other places).
When you’re talking about your product, don’t talk about the fire flower; talk about how you make Mario throw fireballs!

About this newsletter …
Hi, I’m Kevan, a marketing exec based in Boise, Idaho, who specializes in startup marketing and brand-building. I previously built brands at Oyster, Buffer, and Vox. Now I am cofounder at Bonfire, a brand storytelling company.

Each week on this substack, I share playbooks, case studies, stories, and links from inside the startup marketing world. Not yet subscribed? No worries. You can check out the archive, or sign up below:
Thank you for being here! 🙇♂️
I’m lucky to count folks from great brands like these (and many more) as part of this newsletter community.
